
Many influencers and business owners with a strong presence on other social media platforms often question the value of an X Premium account. But let’s clear the air: they couldn’t be more mistaken. X Premium offers an array of benefits, from encrypted messaging and longer content posts to the ability to subscriptions. However, the real game-changer is undoubtedly the access to detailed analytics.
Posting on Twitter without seeing the data is like walking blindly to your destination. Without the metrics update, you can’t tell whether your campaign is fruitful or requires a revision. That is why so many social media marketers purchase Premium X access and gain insights into analytics, along with other perks that come with a paid account.
In this guide, we’ll discuss every aspect of X Premium analytics, including what you can track and how to leverage this data to elevate your account to new heights.
What Is Analytics for Twitter (Now X)?

So, what is exactly Twitter, or now X, analytics? Generally, it is a set of metrics that the platform counts on your account, including followers, engagement rate, impressions, and more. Every interaction that happens on your account or with your ads/campaign is recorded in Twitter analytics.
Both free and paid accounts of X can access analytics, but the extent of it varies. With a free account, you can see:
- Your followers
- Post engagements (incl. Quotes, reposts, and likes)
- Post views
In contrast, with a paid account, you access a considerably larger range of analytics, including:
- Your monthly report card
- Post Activity Dashboard (PAD)
- Video Activity Dashboard (VAD)
- Ads campaigns
- Business Insights Dashboard
- And more!
How to View Analytics on Twitter (Now X)?
Since free analytics are available to everyone, we will be solely discussing the metrics available to Premium accounts. Before we jump to details, you first need to know where to access Twitter analytics.
You can access analytics both on your PC and mobile device:
- On desktop 🖥️
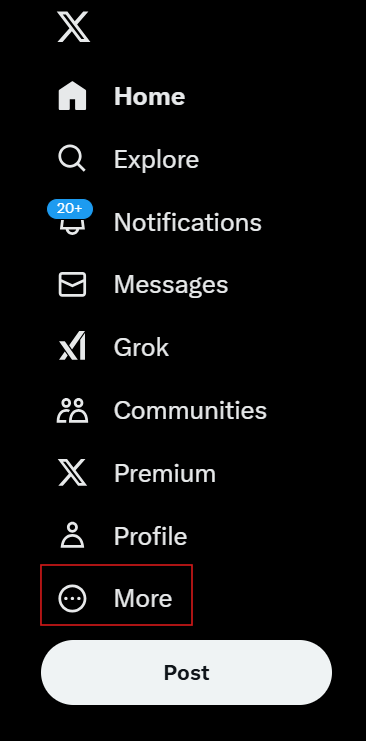
Log in to your Twitter account and locate the three dots in the bottom right corner. Click on the three dots on the side menu and find “Analytics,” which should be located in the “Premium” tab.
- On smartphone/tablet 📱
You can also access analytics on your mobile device by clicking on your profile. In the side menu, choose “Premium” and click on Analytics to see all the metrics available to you.
Alternatively, you can check an individual analytics report of a post. To do that on both desktop and mobile, click on any post and find “View analytics” right below it.

With a free account, you will be able to see only quotes, likes, and reposts. However, in addition to free metrics, a Premium account gives you access to:
- Impressions
- Engagements
- Detail expands
- New followers
- Profile visits
How to Use Twitter Analytics: Tweet Activity
To get the most out of your analytics report, you should understand what each analytics tab is for.
While X provides brief descriptions of each metric and feature, they are intended as quick reminders rather than comprehensive explanations. Therefore, let’s take a moment to explore the meaning of each tab in greater detail.
In the tweet activity tab, you will get access to the following:
| Analytics Tab | Explanation |
| Tweets | You access your posts from the last 28 days and have the most performing ones placed at the top. The analytics page will showcase a graph with daily impression rates, along with other variations of graphs that show the performance of your tweets. |
| Top Tweets | In the “Top tweets,” you can filter from the most and least performing posts based on the impression and exposure rate. |
| Tweets and Replies | Your reply tweets are also included in the “Top Tweets” because they act as regular posts on your feed. Here, you can check the engagement rate of each reply tweet. |
| Promoted | If you have promoted tweets, you can check how they perform, including their exposure rate and follower gain. |
| Video Activity | If you post videos in addition to text posts, you can access analytics of both paid and unpaid video tweets. |
| Conversion Tracking | If your posts prompt the followers to do a certain action (e.g., subscribe, follow, etc.), this tab will help you track the success rate of your campaign. |
Depending on your X account, you may find more features in your analytics or fewer in the case of a free account. As for tracking the growth rate of your account, these metrics are key to understanding how your audience interacts with your content, identifying trends, and optimizing your strategy to achieve better engagement and growth.
How to Use Twitter Analytics Data

After covering the meanings of each tab, we can move on to the most important data in Twitter analytics and how you can put it to use. Among all the metrics, there are the main 6 ones you want to track and improve as you grow your X account. They are:
| Metrics | Description |
| Impressions | X Analytics tracks how often your tweets appear on timelines. Although appearing in the feed does not guarantee engagement, it indicates that your tweets reach your target audience. |
| Engagements | Engagements are the interactions users have with your tweets, be it liking, retweeting, or simply clicking on them. High engagement means your content is performing as it should. |
| Engagement Rate | The rate of engagement is a clear measure of your tweet performance. To get this data, you need to divide the number of engagements by the number of impressions (e.g., 22/300=0.07 or 7%). |
| Mentions | X also tracks how often you are mentioned on the platform. |
| Profile Visits | In addition to tweet views, you can also check how many people got an interest in your account and visited your profile. |
| Followers | The platform tracks how many people joined and left and shows an overall growth trend of your following. |
Now that you know your way around X Analytics, you can use the data to analyze it and find growth opportunities for your account. Here are some tips to help you get started:
Impressions and Reach
Impressions are the number of times your tweets appeared on a timeline, while reach is the number of users that could possibly see and interact with your tweet.
The bad part about impressions is that it doesn’t indicate that a user even paid slight attention to your post–it is just the fact that your tweet was a part of someone’s feed, but nothing more.
That’s why it is important to compare impressions with reach even if X Analytics does not provide this data. Reach typically correlates with your follower count; for example, if 1,000 users follow your profile, your minimum potential reach would be around that number. This comparison helps you understand how effectively your content is being delivered to your audience.
💡How to use it:
- Compare impression to engagement rates: If your tweet has a high impression rate but low engagement, polish your content to make it more appealing to the users.
- Promote tweets: Consider promoting your tweets with X Ads to reach a wider audience.
- Encourage your followers to engage with content: Ask your followers to retweet, like, or share your content to boost engagement and reach for your tweets.
Engagements and Engagement Rate
Engagement is every like, retweet, reply, and click linked to your post. This metric helps understand whether users are interested in your posts and are interacting with your content. This means that if you launch a campaign prompting your audience to visit a website or an online store, there is a high chance that they will.
To understand whether the number of engagements is positive, you need to extract an engagement rate. To do that, you need to divide the number of engagements by the number of impressions.
Suppose you have a tweet that reached over 2,000 impressions, and the engagement number is no more than 40. Here is what you need to do:
40/2,000 = 0.02
The engagement rate of 00.2, or just 2%, is very low, indicating that your content strategies are underperforming.
Keep in mind that this is just an example. In reality, a low engagement rate may earn you 100 new followers or even more, and vice versa.
💡How to use it:
- Identify successful tweets: Review tweets with the highest engagement rates and analyze what resonates best with your audience. It could be images, your tone of voice, or anything else.
- Optimize old tweets: If the engagement rate on some tweets remains low, try incorporating visuals, adding stronger CTAs, or incorporating trending hashtags.
Tweet Activity
How X users engage with your tweets provides valuable insights into your audience’s behavior. Tweet activity highlights the performance of individual posts, helping you pinpoint what resonates and what doesn’t.
For example, if one tweet gains significant likes and retweets while the next goes unnoticed, you can analyze the differences to understand what may have gone wrong. Is the time of posting, the CTA, or the lack of visuals?
💡How to use it:
- Seasonal insights: Your posts’ activity can be linked to the holidays, special events, or frequency, which could experience ups and downs. Identify when your audience is most active and take advantage of it.
- Analyze older tweets: If you have tweets with high engagement rates, replicate the same elements you used there in your future posts.
- Experiment with tweets: You should experiment with different tones of voice, visual elements, CTAs, and tweet formats to see what gains the most attention of your audience.
Seeing Beyond the Details
Data is key for tracking growth and measuring success, but sometimes stepping back and seeing the bigger picture is just as important.
While X Analytics provides valuable insights, you will achieve success by combining data-driven decisions with high-quality content and meaningful interactions with your audience.
Building a strong online presence should be reflected not just in the numbers but also in the genuine connections you create and the steady growth of your follower base.
Bulkoid has helped numerous content creators and business owners grow their accounts by boosting key metrics that attract loyal audiences.
Be the next one to achieve your goals–let Bulkoid help you.
Frequently Asked Questions
How can I export data from Twitter Analytics?
Click “Export Data” near the date range menu to download a CSV file containing metrics like impressions, engagements, and clicks.
How can I adjust the date range in Twitter Analytics?
Use the date range menu in the top-right corner to select predefined periods or customize a specific range, then click “Update.”
What does the engagement rate measure?
The engagement rate is the percentage of impressions that result in user interactions, such as likes, replies, or clicks.
Why is analyzing tweet activity important?
Analyzing tweet activity helps identify which content resonates best with your audience so that you can optimize your strategy for better results.